Getting Started with Digital Analytics
What is digital analytic?
- Using data to drive change. The change desired is based on individual or business objectives
Why digital analytics is important?
- The traditional sales funnel is very linear, it assumes customers will appear at one place, and guides them in a funnel until a conversion(purchase). In the digital world, a purchase can happen at any point of a decision path. The control is shifting from firm to customers.
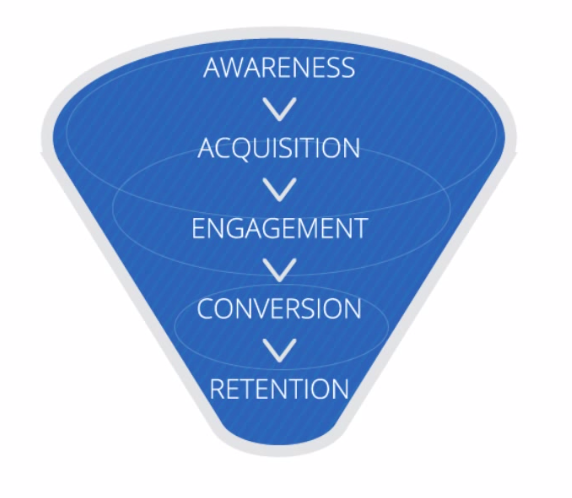 |
| The Traditional Sales Funnel |
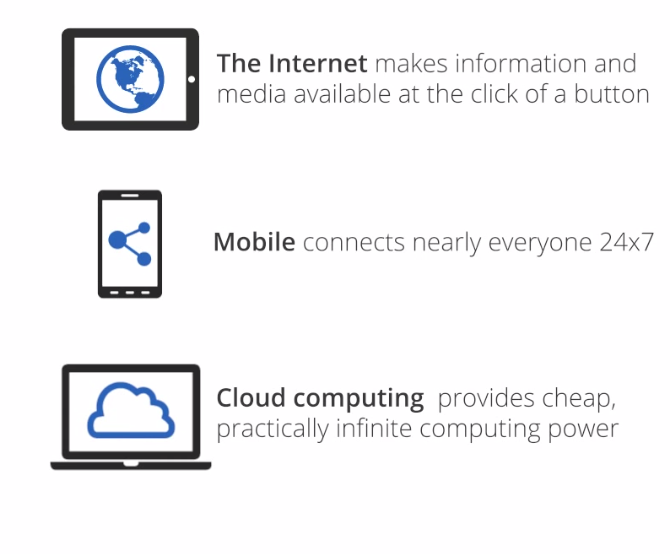
- The traditional sales funnel breaks apart in the digital world. Four trends that is changing the landscape of traditional sales funnel.
- Internet
- User can access any information of products and services from computer with internet connection. They can compare prices very fast.
- Mobile devices and applications
- Coupled with internet connection, customer can search and compare product and service price/review/history, 24/7
- Cloud computing
- Firms can ignore infrastructure maintenance/setup/security/cost, and just focus on analyzing data and application.
- 3D printers
- This is more related to product development. Customers can print their own spare parts/components and devices, without purchasing from firms.
 |
| The change of customer behavior because of digital trends |
- Hence we need to analyze more on the customer(behavior), rather than the channel they are accessing a site.
- A marketer should understand the customer behavior and anticipate where the customer can appear, and what message to they need to hear.
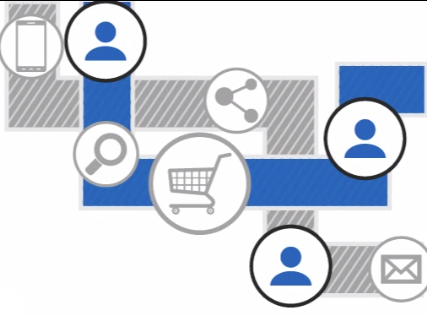 |
| User is in control |
Definition of Digital Analytics
Avinash Kaushik's( a digital analytics evangelist) definition of Digital Analytics is:
Digital Analytics is the analysis of qualitative and quantitative data from your business and the competition to drive a continual improvement of the online experience that your customers and potential customers have which translates to your desired outcomes(both offline and online).
Quantitative Data
- This data is generated when user uses a site. Example are page visits, geographic location.
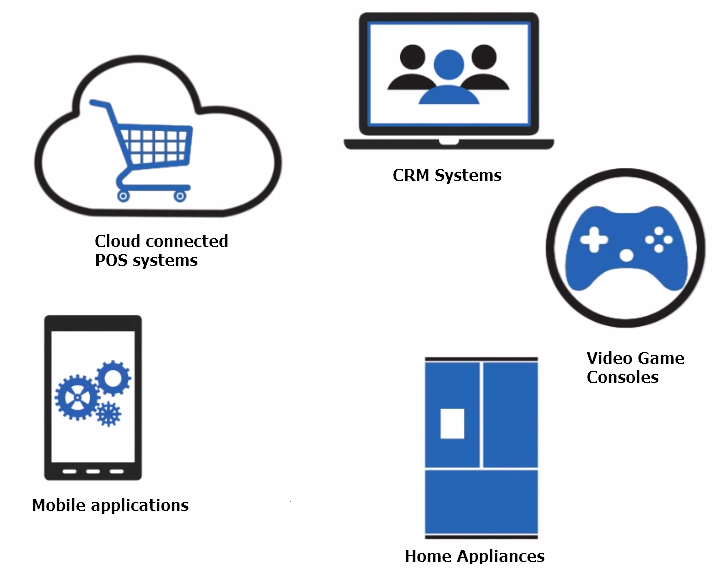
- Previously GA can only collect data from web sites. Now it can collection from various devices and applications used by users. This gives a holistic point of view of how a user behaves and we target according to their behavior
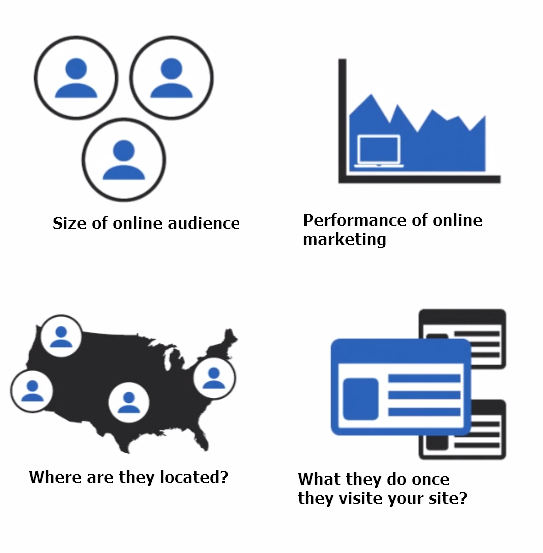 |
| Example of quantitative data generated from user activity |
 |
| Example of quantitative data generated from user activity from different locations |
Qualitative Data
- Data that explain why a user behaves in certain ways. For example, survey, and polls.
- Show how a user experiences your site, that you cannot get from quantitative data.
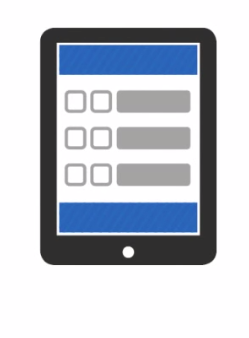 |
| Example of qualitative data are survey, polls, and user reviews |
Outcomes
- Before we do some data analytics, we need to understand what is our ultimate business objectives and outcomes, and how do you expect to measure those outcomes.
- Its important to have a clear measurement strategy to guide your implementation strategy, and your data analysis.
- For a online world, the 5 common business objectives are:
- E-commerce:
- Sell more products & services
- Lead generation:
- Collect user information for sales team to connect with potential leads.
- Content publisher:
- Encourage, engage customers & frequent visitation
- Online info/support:
- Help user to find information they need at the right time.
- Branding
- Drive awareness, engagement, loyalty.
 |
| 5 common business objectives |
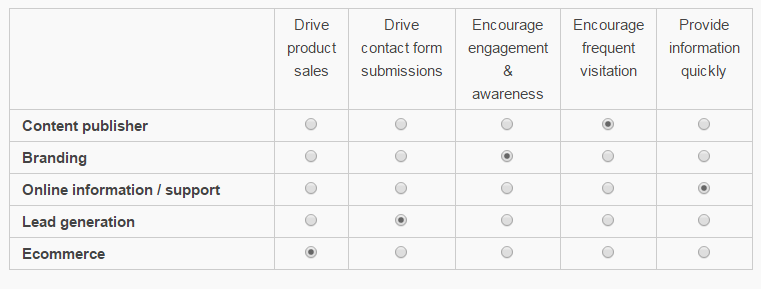 |
| Business Type and Their Desired Outcomes |
- There are keys action on a site or mobile site that can be tied back to the business objectives.
- When an action indicate a business objective is fully meet, we call them macro conversion
- Some actions don't not indicate a business objective is fully meet, but they indicate their are getting near to the business objectives. We call them micro conversion
- We need both micro and macro conversion to better understand how the desired outcomes are being meet.
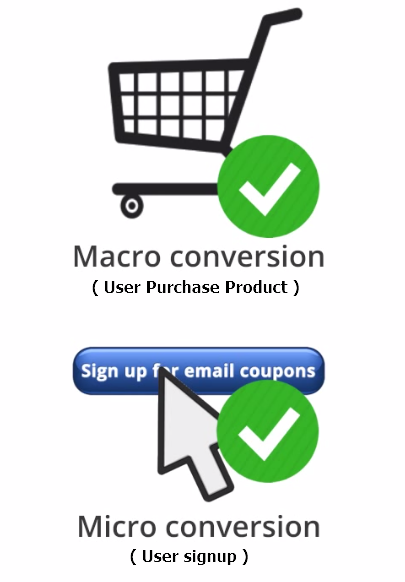 |
| Example Of Macro and Micro Conversion In A E-comerce Site |
Continual Improvement
- Data can be used for continual improvement for your business. The continual improvement process can be broken to five steps are:
- Measure
- Collecting the data needed to answer your business questions. Ex, How many people are completing the customer journey? Where along the journey we are losing or retaining customer
- Report
- Package the data in a readable format, and get data out to the decision makers. So they can have the information they need to do business decisions. Ex, distributing pre- made dashboard
- Analyze
- Identifying large trends. It can also be complex( identifying deep segmentation of your data), or a competitive analysis(Compare your result with industry benchmark)
- We will create hypothesis that match our expectation, and figuring why the numbers do or do not match our expectation.
- When unexpected things happen in your data, analyze helps us to figure out why.
- Test
- We try different solution to the problem, that we identified during the analysis.
- This is important because it takes out opinion from the decision making process to discover improvement opportunities.
- Improve
- We repeat what we learn and we improve
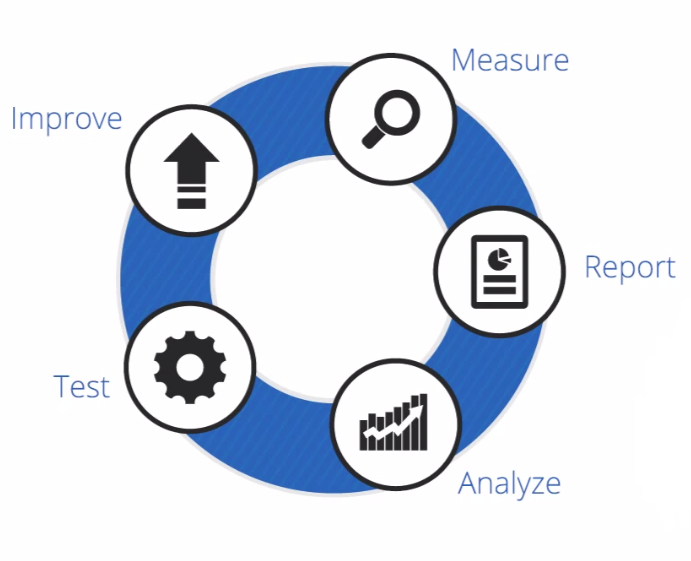 |
| The Process Of Continual Improvement |
Read further: